
Investment Algorithms offers what I believe to be a rare trading method. Most traders running chat rooms seem to employ no more than support and resistance areas or moving averages. My method employs charts of two different well-selected time periods. First we identify a favorable situation for a reversal back in the direction of a trend on the larger time period, then we look for a change in momentum on the smaller time period. The criteria to enter a short position is exactly the opposite of the criteria to enter a long position. My method has undergone extensive testing on periods as long as monthly and as short as 1-minute with extremely good results.
Two examples, both with charts, below:
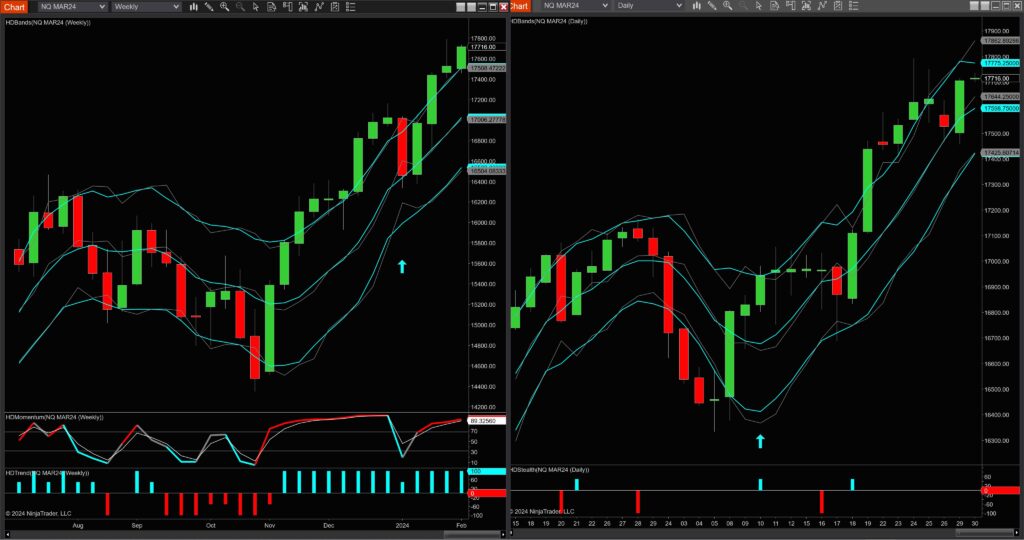
The first example alerts us of a potential long position on weekly and daily charts. The chart on the left just below is the larger weekly time frame, while the chart immediately to its right is the shorter daily time frame. When we notice a candle on the larger time frame where the momentum line has reached oversold while the trend histograms are cyan, we know there could very soon be an opportunity to take a long position. This condition happened on the weekly red candle during the first week of 2024 and is marked on the leftmost chart by a cyan up arrow. Then we watch the rightmost chart and wait for a daily candle with a cyan histogram on the shorter time frame, marked on the rightmost chart by a cyan up arrow. We take a long position on the shorter time frame chart if a later candle violates the high of the candle with the cyan histogram.
Below: Weekly and daily charts for the March 2024 Nasdaq 100 E-mini futures contract
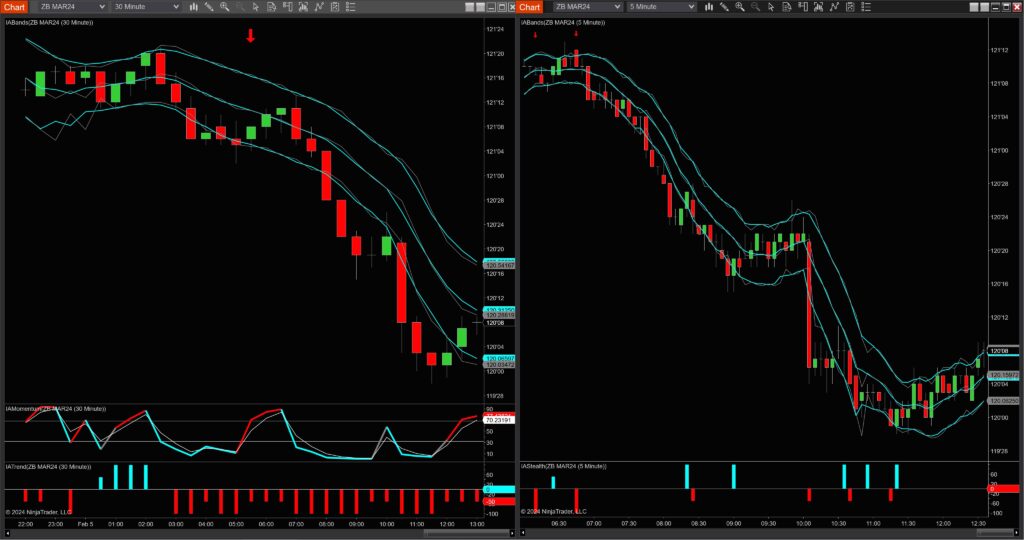
The second example alerts us of a potential short position on 30-minute and 5-minute charts. The chart on the left just below is the larger 30-minute time frame, while the chart immediately to its right is the shorter 5-minute time frame. When we notice a candle on the larger time frame where the momentum line has reached overbought while the trend histograms are red, we know there could very soon be an opportunity to take a short position. This condition happened during the 5:30 am 30-minute candle and is marked on the leftmost chart by a red down arrow. Then we watch the rightmost chart and wait for a 5-minute candle with a red histogram on the shorter time frame, marked on the rightmost chart by a red down arrow. We take a short position on the shorter time frame chart if a later candle violates the low of the candle with the red histogram.
Below: 30-minute and 5-minute charts for the March 2024 30-year Treasury Bond futures contract
It seems simple enough, right? It is, yet it’s the distillation of 42 years of market study.
This method provides opportunities for trades just about every day on any financial instrument, providing the time period is short-term enough.
Feel free to check out the six months worth of trades in my free Discord, trades employing a generous variety of different time periods ===> Discord
Also, feel free to check out the charts on the “Charts” page, with more to follow ===> Charts
Click the Free Trial button to the right to be set up for a free trial ===> Free Trial
Futures and forex trading contains substantial risk and is not for every investor. An investor could potentially lose all or more than the initial investment. Risk capital is money that can be lost without jeopardizing one’s financial security or lifestyle. Only risk capital should be used for trading and only those with sufficient risk capital should consider trading. Past performance is not necessarily indicative of future results.